make preferable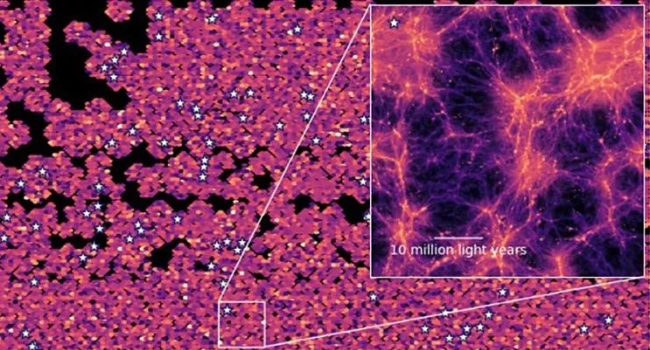
Astronomers have unveiled one of the most ambitious and unusual maps of the early Universe — a three-dimensional model of a “sea of light” filling the space between galaxies roughly 9–11 billion years ago, during the era known as “cosmic noon,” when star formation in the Universe reached its peak.
The map was created using data from the HETDEX (Hobby-Eberly Telescope Dark Energy Experiment) conducted with the Hobby-Eberly Telescope in Texas. The results were published March 3 in The Astrophysical Journal.
What scientists were able to observe
HETDEX was originally designed to measure the expansion of the Universe and study dark energy. However, researchers used its vast archive — more than 600 million spectra — to reconstruct not just the positions of bright galaxies but the distribution of hydrogen throughout large volumes of space.
The key signal comes from Lyman-alpha emission, an ultraviolet glow produced by hydrogen atoms when they are energized by radiation from young, hot stars. This emission serves as a signature of intense star formation in the distant past.
Robin Ciardullo, a co-author of the study, explained that Lyman-alpha radiation is a crucial characteristic of galaxies during this period of cosmic history, when star formation activity was extremely high.
Previous maps of the Universe focused primarily on bright galaxies, which researchers often compare to cosmic cities. The HETDEX team went further by measuring the total Lyman-alpha light across enormous areas of the sky, rather than tracking individual galaxies.
Lead author Maya Lujan Niemeyer noted that regions of space that appear empty at first glance actually contain an entire sea of faint light.
The result is less like a map of cities and more like a heat map of illumination across the cosmic web, revealing the faint glow permeating intergalactic space.
How the map was constructed
The technique used is known as Line Intensity Mapping. Instead of identifying galaxies one by one, scientists measured the combined intensity of a specific hydrogen emission line across large areas of the sky.
Using supercomputers and specialized software, they reconstructed the three-dimensional structure of the Universe from these signals.
Bright galaxies served as calibration points, helping researchers determine where the faint background emission in apparently empty regions originated. This allowed the team to reveal not only large-scale structures but also thin filaments of gas connecting galaxies, which supply the material needed for star formation.
Why the discovery matters
The map provides new insight into how galaxies accreted gas, formed stars, and assembled into the large cosmic structures seen today.
It also signals the beginning of a new era in cosmic cartography. Future astronomical surveys are expected to increasingly rely on line intensity mapping, allowing scientists to observe not only bright galaxies but the entire glowing framework of the Universe.
Daniel Holz of the University of Chicago, a co-author of the study, said the approach represents an exciting new direction and that applying these methods to future datasets could help refine measurements of the Hubble constant and other fundamental cosmological parameters.
Another co-author, Caryl Gronwall, described the work as an important first step toward using intensity mapping to understand how galaxies form and evolve.
In brief
Using data from the HETDEX experiment, astronomers created the largest 3D map of the early Universe, covering the period 9–11 billion years ago. The map reveals a faint “sea of Lyman-alpha light” produced by hydrogen between galaxies. Built with the Line Intensity Mapping method, it traces vast volumes of space and highlights the role of intergalactic gas in star formation and cosmic structure formation. The study, published March 3 in The Astrophysical Journal, points toward a new approach in cosmology that maps not only bright galaxies but the entire luminous framework of the Universe.